Each year, Running USA compiles and analyzes data gathered at running events around the country to bring us its annual State of the Sport report. We highly recommend you check it out, but for those who want the abridged version, here are some key takeaways from the 2015 race year.
We’re Not Tired of Running
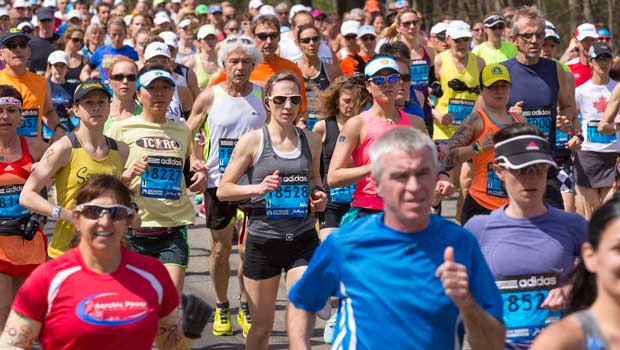
American runners are knocking out an average of 20 miles per week, and the overwhelming majority (73 percent) tend to run year-round. While competitive runners (14 percent) remain an admirable minority, running does not breed exclusivity. More than two-thirds of those polled identified as frequent/fitness runners who typically hit the pavement around four times per week.
We aren’t just running often; we’re running early. Sixty-three percent of those surveyed said they prefer to beat the rooster out of bed for an early morning run. Staying healthy and in-shape is the primary source of motivation for American runners, with another 66 percent opting in to alleviate stress.
Distance Matters
The top factor impacting race participation is distance, with nearly 70 percent of respondents citing course length as their primary consideration. The distance most preferred by runners? Resoundingly, that’s the half marathon (40 percent) followed by the 10K (19 percent).
Women comprise a significant majority (63 percent) of race participants, and runners report equal attendance with the intention of participating for fun or competition. On average, U.S. runners average seven events per year, with seven more forecasted for the coming year.
Word-of-mouth and Facebook have emerged as key information channels for events and race info, and more than two-thirds say it’s easy to find an event. Americans are also willing to travel overnight for a race, with three-fourths of those polled reporting significant travel for an event in the past year.
Pumped Up Kicks
Americans average three pairs of running shoes per year, at just over $100 for each pair purchased. In the least surprising news ever, 92 percent of respondents tabbed fit/comfort as the most important criteria when in search of new kicks.
As it turns out, there exists significant customer loyalty, as well. Approximately half of us most recently purchased the same brand that we always wear—and 68 percent of us intend to stick with the status quo the next time around.
Brooks (23 percent), ASICS (18 percent) and Saucony (14 percent) make up more than 50 percent of the shoes adorning the feet of American runners, with Nike a distant fourth (nine percent). Don’t feel bad the folks up in Oregon, though. Half of those polled listed Nike as their favorite apparel brand—placing the Swoosh atop the apparel list, just ahead of Under Armour (41 percent).
Social Media Impact
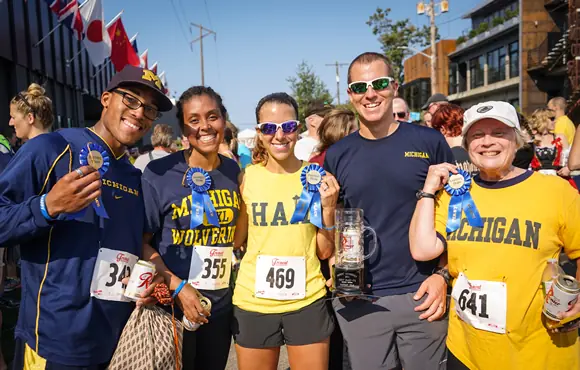
The impact of social media on the running community grows each year. In 2015, half of us were in the habit of posting race photos and videos, general running photos and videos, and/or discussing race-related activities on Facebook. Over four-in-10 used a social platform to recruit others to join them for a race, communicate with training partners, follow other runners, post race results and seek running motivation.
Women post to social media much more than men. Seventy percent of women said they post photos and videos to Facebook post-race, while just 53 percent of men claimed to do the same. Regardless of gender, we all know that those post-race photos are Instagram gold, worthy of so many likes.
At least half of us now run with a phone, sports watch and/or GPS—with the mobile device, unsurprisingly proving to be the most central gadget for running activities overall.
Oh, and not for nothing: Active.com is the website most often visited by runners (51 percent).
 Sign up for a race.
Get ACTIVE on the Go


Couch to 5K®
The best way to get new runners off the couch and across the finish line of their first 5K.
Available for iOS | Android


Discuss This Article